This web page was produced as an assignment for Genetics 564, an undergraduate capstone course at UW-Madison.
AQP2 Phylogeny
What is Phylogeny?
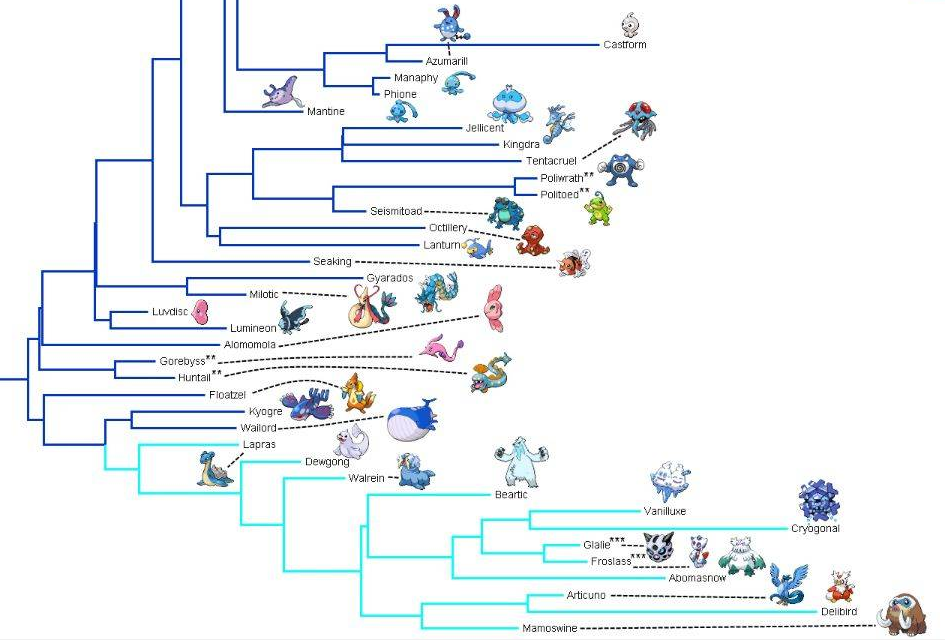
Phylogeny is the study of the evolutionary relationships between species. Species can be compared in numerous ways, including protein and gene sequences. The above phylogenetic tree of Pokémon was generated mainly based on type(elemental attribute with which they are associated) and the ability of Pokémon to breed with each other(1). The internal nodes where branches split are the points of most interest on phylogenetic trees, and the inter-relatedness of two organisms at the outer leaves of a tree are always evaluated based on the internal branching leading to the tree's exterior(2). All of the leaf organisms that are derived from the same internal node are defined as a clade. In the above tree, Articuno and Delibird together form a clade; as do Vanilluxe,Cryogonal, Glalie, and Froslass. Phylogenetic trees often include organisms that define clades of other organisms through shared traits. These organisms are known as outgroups. Outgroups can be defined at multiple levels within phylogenetic trees, for example Mamoswine is an outgroup for the Articuno and Delibird clade.
How is level of similarity between sequences determined?
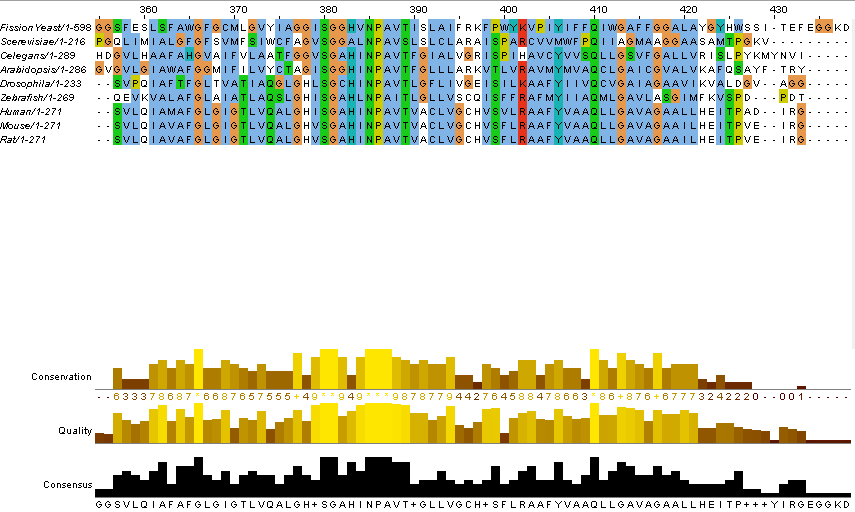
Before sequences can be compared, they must first be aligned to each other to match corresponding regions. For the aquaporin-2 homolog trees shown below, the ClustalOmega platform was used(3). Here is the alignment of my aquaporin-2 homologs:
Two commonly used approaches for comparing protein sequences between different species are using the BLOSUM62 matrix and % identity. Both of these approaches assign values to an alignment of a pair of two different proteins, and these values can then be used to build the phylogenetic tree.
When using the BLOSUM62 matrix, the amino acid identity at each position in the aligned proteins is determined. Based on the combination of amino acids, each position within the alignment is assigned a score from the matrix(4) The score for the overall alignment is then the sum of scores across the positions in the alignment, with higher positive sums indicating more similar sequences.
In contrast, % identity only adjusts the overall score for an alignment if a position in the alignment has the same amino acid in both sequences. All positions at which the amino acids are different in the two proteins are ignored(5).
How is a tree built?
Two different methods that can be used to create phylogenetic trees from pairwise similarity scores are average distance and neighbor joining.
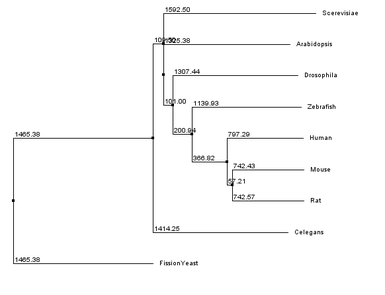
The primary difference between the two methods is in how lengths of branches connecting two leaves are assigned. In average distance approaches branches from both leaves are assigned the same length, while in neighbor joining the branch lengths associated with the two leaves may be unequal(6). All four possible combinations of similarity methods and tree building strategies were evaluated for aquaporin-2 homologs, as seen below.
The primary difference between the two methods is in how lengths of branches connecting two leaves are assigned. In average distance approaches branches from both leaves are assigned the same length, while in neighbor joining the branch lengths associated with the two leaves may be unequal(6). All four possible combinations of similarity methods and tree building strategies were evaluated for aquaporin-2 homologs, as seen below.
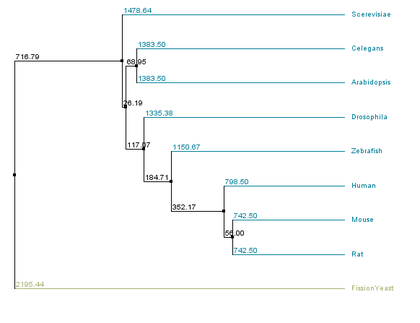
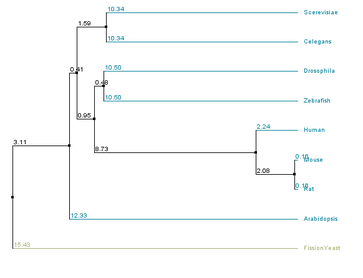
BLOSUM62 average distance
BLOSUM62 neighbor joining
|
% identity average distance
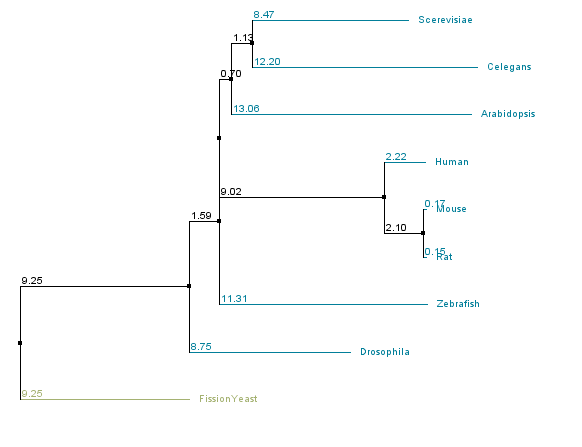
% identity neighbor joining
|
Discussion of Trees
There are similarities among the four individual trees that are noteworthy. All four trees have fission yeast as an outgroup, suggesting that water transport channels may have diverged in function in fission yeast compared to other species. All four trees also have a clade consisting of the human, mouse, and rat sequences, suggesting functional conservation in mammals of water channels. However, in trees that used the BLOSUM62 matrix all vertebrate sequences form a clade, while they do not within the % identity trees. This suggests that several stretches of amino acids within the sequences of the homologs are well conserved across the organisms sampled, while other regions only have high conservation in closely related organisms.
References
1. Shelomi, M., Richards, A., Li, I., & Okido, Y. (2012). Phylogeny and Evolutionary History of the Pokémon.Annals of Improbable Research. 18(4):p.15-17.
2. University of California Museum of Paleontololgy. Understanding Evolution. evolution.berkeley.edu/evolibrary/home.php. Accessed February 14th, 2017.
3.Clustal Omega. www.ebi.ac.uk/Tools/msa/clustalo/. Acessed February 14th, 2017.
4. University of Kentucky. BLOSUM62 Substitution Matrix. www.uky.edu/Classes/BIO/520/BIO520WWW/blosum62.htm. Accessed February 14th, 2017.
5.Anna Lisa Doebly. http://doebleygen564s14.weebly.com/how-to-make-a-phylogenetic-tree.html
6. Cold Spring Harbor Laboratory Press. http://evolution-textbook.org/content/free/contents/ch27.html#ch27-4-2
