This web page was produced as an assignment for Genetics 564, an undergraduate capstone course at UW-Madison.
What is Transcriptomics?
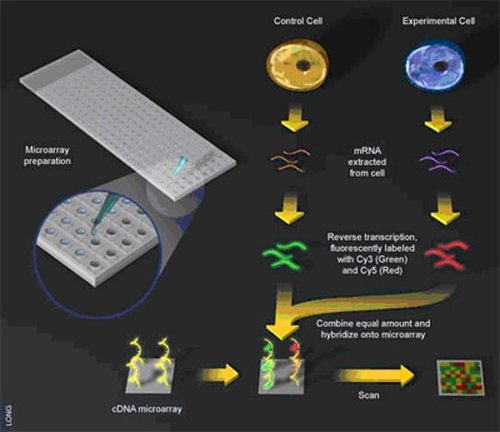
Figure 1: Workflow for a microarray experiment
|
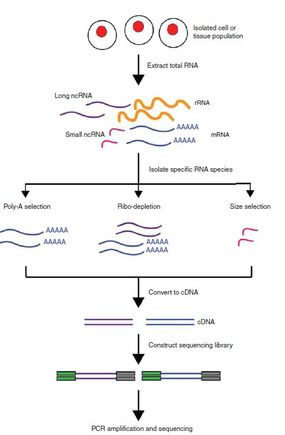
Figure 2: Workflow for an RNA seq experiment
|
Transcriptomics is the study of RNA found within cells or tissues (1). Comparison of RNA levels between different cell types can provide information on differences in gene expression between cells.
There are two primary approaches for performing transcriptomic studies: microarrays and RNA sequencing(RNA seq). In both approaches, RNA extracted from cells is transformed into complementary DNA (cDNA) using reverse transcriptase. The two techniques mainly differ in how they detect cDNA. Microarrays use DNA probes to hybridize to cDNA of interest and then detect hybridization based on fluorescent labels on the cDNA (2). RNA seq instead sequences the cDNA fragments, which can then either be matched to an existing reference genome or used to generate a reference transcriptome de novo (3).
These different approaches have different strengths and weaknesses. Microarrays are inexpensive and easy to analyze, but there are frequent occurences of non-specific cDNA hybridization that can skew results, and they require knowledge of the genome of the organism being studied(4). RNA-seq is not as suspect to errors and can be used with organisms that do not have annotated genomes, but is much more expensive and data analysis is much more challenging. Thus the best approach will depend heavily on available resources and the organism in which the study is being performed.
Microarray data for human AQP2
This microarray data was found using GeoProfiles (5) searching for AQP2 within the kidney in humans.
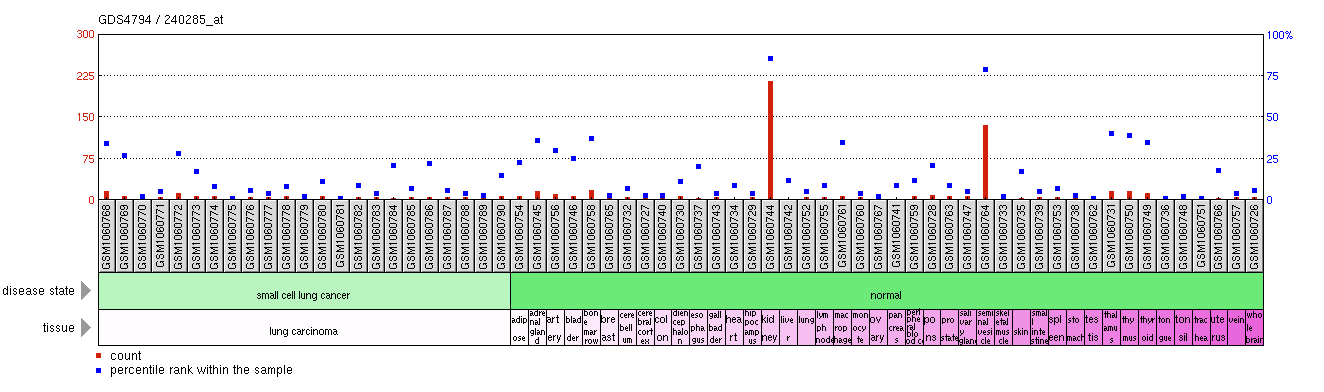
Figure 3: Comparison of AQP2 expression across a wide spectrum of tissues. Expression is highest within the kidneys and seminal vessicles.
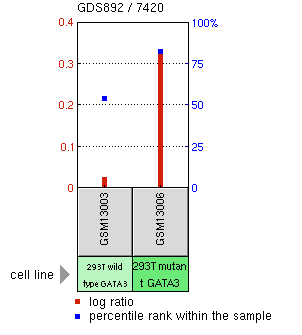
Figure 4: Comparison of AQP2 expression between wild type GATA3 and mutant GATA3. This particular mutant of GATA3 causes greatly heightened AQP2 expression.
Discussion of Microarray Data
High expression of AQP2 within the seminal vesicles of rats has been previously noted (6), so AQP2 expression within the seminal vesicles of humans is not completely unexepected. Of greater interest is the change in AQP2 expression associated with GATA3 mutants. GATA3 is a transcription factor that has been previously implicated in HDR synrdome (7), of which one of the symptoms is kidney abnormalities. This microarray data therefore suggests that AQP2 transcription is regulated by GATA3, and GATA3 may therefore possibly be a target for development of therapeutics for NDI.
References
1. Transcriptome. https://www.genome.gov/13014330/. Accessed March 9th, 2017.
2. DNA Microarray Technology. https://www.genome.gov/10000533/dna-microarray-technology/. Accessed March 9th,2017.
3. RNA seqlopedia. http://rnaseq.uoregon.edu/. Accessed March 9th,2017.
4. Zhao, S. R., Fung-Leung, W. P., Bittner, A., Ngo, K., & Liu, X. J. (2014). Comparison of RNA-Seq and Microarray in Transcriptome Profiling of Activated T Cells. Plos One, 9(1). doi:10.1371/journal.pone.0078644
5. GEOProfiles. https://www.ncbi.nlm.nih.gov/geoprofiles/. Accessed March 9th,2017.
6. Pei, L. J., Yang, G. S., Jiang, J., Jiang, R., Deng, Q. F., Chen, B., & Gan, X. L. (2013). Expression of Aquaporins in Prostate and Seminal Vesicles of Diabetic Rats. Journal of Sexual Medicine, 10(12), 2975-2985. doi:10.1111/jsm.12276
7.Van Esch, H., Groenen, P., Nesbit, M. A., Schuffenhauer, S., Lichtner, P., Vanderlinden, G., . . . Devriendt, K. (2000). GATA3 haplo-insufficiency causes human HDR syndrome. Nature, 406(6794), 419-422. doi:10.1038/35019088
